|
How much of global greenhouse gas emissions come from
food?
by Hannah Ritchie
March 18, 2021
Our World in Data presents the data and research to make progress
against the worldÆs largest problems.
This blog post draws on data and research discussed in our entry on
the Environmental impacts of food production.
Summary
There are a wide range of estimates for how much of the worldÆs total
greenhouse gas emissions come from food. Some studies say this figure
is one-quarter, some say itÆs more than one-third.
Where do these differences come from? There are three reasons why some
of these estimates vary so much:
1) some studies do not include emissions from cooking and food waste;
2) different studies disagree about the emissions from land use change
and deforestation;
3) some, but not all, studies include non-food agricultural products
such as cotton, wool, leather and biofuels
The specific number that answers this question depends on these three
factors, but the range of possible answers is not too large: around
25% to 30% of global emissions come from our food systems, and this
rises to around one-third when we include all agricultural products.
People are becoming increasingly aware that
their diet comes with a climate cost. But just how much of our
greenhouse gas emissions comes from food?
In a previous article I looked at where greenhouse gas (GHG) emissions
in the food system came from ¢ ranging from deforestation and land
use, through to transport and packaging. The study my article was
based on was published by Joseph Poore and Thomas Nemecek, estimated
that the food system was responsible for one-quarter (26%) of global
emissions.1 A new study, published by Monica Crippa and colleagues in
Nature Food estimates a higher share: one-third (34%) of emissions.2
In this article I want to explain where the differences in these
estimates come from. You can explore the results of the study by
Crippa et al. (2021) on our work on the Environmental impacts of food
here.
One-quarter or one-third: how
much of global emissions come from food?
It is nothing new that estimates of food
emissions span a wide spectrum. The Intergovernmental Panel on Climate
Change (IPCC) Special Report on Climate Change and Land reports a
range from 10.8 and 19.1 billion tonnes of CO2-equivalent (CO2e)
emissions per year.3 ThatÆs between 21% to 37% of global total
emissions. Quite a big difference. WeÆll soon see where these
disagreements come from.
In light of this, the difference in estimates from Poore and Nemecek
(2018) of one-quarter, and Crippa et al. (2021) of one-third are not
that surprising. They fall right in the middle of this wide range.
Given that they are using very different methods to get to these
numbers it is actually encouraging, from a research perspective, that
these estimates are so close to each other. But we should still try to
figure out where the differences come from.
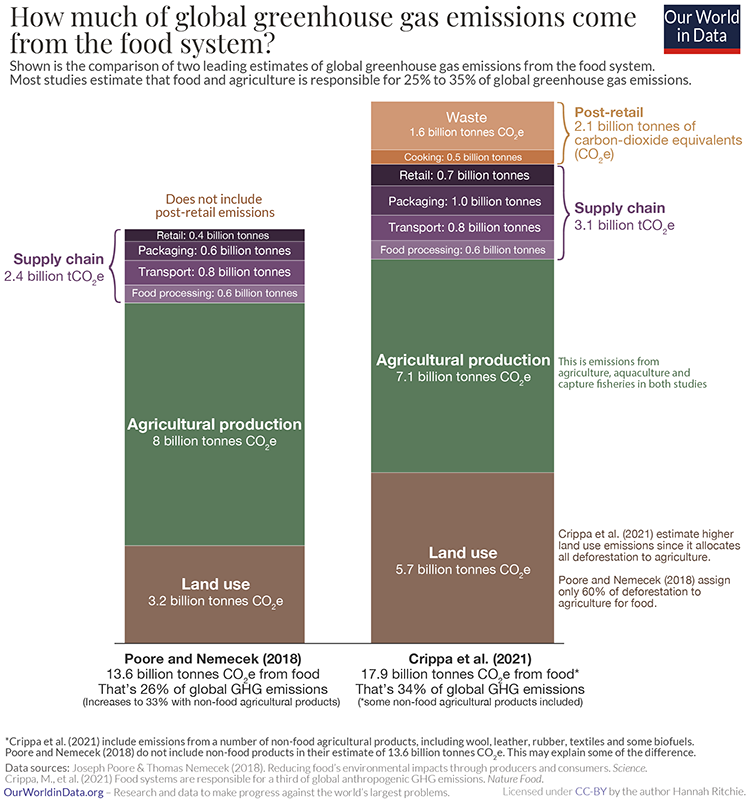
In the chart here IÆve shown the results of these two studies
side-by-side. IÆve grouped emissions into their comparable parts of
the food chain:
Land use: this includes deforestation, peatland degradation and fires,
and emissions from cultivated soils.
Agricultural production: this includes emissions from synthetic
fertilizers (and the energy used to manufacture them); manure; methane
emissions from livestock and rice; aquaculture; and fuel use from
on-farm machinery.
Supply chain: this includes all emissions from food processing,
packaging, transport, and retail, such as refrigeration.
Post-retail: this is all the energy used by consumers for food
preparation, such as refrigeration and cooking at home. It also
includes emissions from consumer food waste.
Poore and Nemecek, shown on the left, estimated that food was
responsible for 13.6 billion tonnes of CO2e. Crippa et al. estimate
17.9 billion tonnes of CO2e. So, thereÆs a difference of around 4
billion tonnes. Where does it come from?
Consumer cooking and waste are not always included in Poore and
Nemecek: the easiest differrence to spot is that Poore and Nemecek
only quantify emissions up to the retail stage of the supply chain.
They donÆt include energy use by consumers or consumer waste. As we
see from the chart, this amounts to 2.1 billion tonnes CO2e.
Land use emission estimates differ: the biggest difference is in land
use emissions. Crippa et al. (2021) estimate emissions to be 2.5
billion tonnes CO2e higher. This can be largely explained by
differences in the attribution of deforestation. They allocate all of
global deforestation to agriculture. However, the authors note that
this is a main limitation of their approach, since only around 80% of
deforestation is driven by agricultural expansion (the rest driven by
urban development, mining and other human land use change). So their
deforestation estimate is possibly a bit too high. Poore and Nemecek
only allocated 60% of deforestation to food systems. This might be a
bit of an underestimate. Land use emissions due to agriculture are
likely to be somewhere in the middle of these two values.
Food vs. non-food agricultural products: the other main difference is
that Poore and Nemecek only include food products in their 13.6
billion tonnes CO2e figure. Non-food agricultural products such as
cotton, wool, leather, rubber and biofuels are not included. They do
also provide a separate estimate which includes non-food products;
this estimates that agricultural products as a whole contributes 33%
to global emissions. Crippa et al. (2021) do include at least some of
these non-food agricultural products in their estimate.
Comparing these two studies is useful because they highlight the main
differences we see across the range of studies on food emissions. The
big differences are: what stages of the supply chain are covered (some
studies include consumer cooking and waste, some donÆt); whether
non-food agricultural products such as biofuels and textiles are
included; and the biggest uncertainty is emissions from deforestation
and land use change. The uncertainty in deforestation emissions
estimates from the UN FAO can be as high as 50%, and over 100% for
emissions from peatlands.4 Deforestation can also vary a lot from
year-to-year, so decadal average values are often used.
How much of global greenhouse gas emissions come from food systems?
The amount of uncertainty in these estimates means itÆs helpful to
understand where the differences come from, and that they all fall
within a reasonably narrow range. If someone asks me, my response is
usually ōaround 25% to 30% from food. Around one-third if we include
all agricultural products.ö
More articles on this topicģClick
Here
Green Play AmmoniaÖ, Yielder« NFuel Energy.
Spokane, Washington. 99212
www.exactrix.com
509 995 1879 cell, Pacific.
exactrix@exactrix.com
|